Engine Management Systems & Related Topics
Modern air/fuel ratio sensors can sometimes bring a little bit of confusion as they can be hard to test.
You certainly can't test amperage with them using a lab scope. You really have to check in the scan data to see what that air/fuel ratio sensor is doing and whether or not it's actually working properly.
So let's go through a little bit of a description of how they work and then we'll go through the scanner and see how to test them.
Let's get into some information about how they work first. There’s a good place for that, if you have a scan tool with Guided Component Tests.
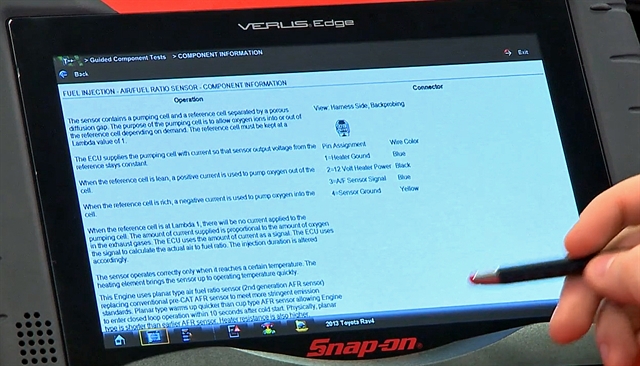
With the tool hooked up to our vehicle, a Toyota Rav4 for this example, we'll go in to the Guided Component Tests menu, to the Fuel Injection System, and there it is – Air/Fuel Ratio Sensor.
The first thing to go to is Component Information once we open a component, so we'll go in there and see how it works.
The sensor contains a pumping cell and a reference cell separated by a porous diffusion gap. So basically it's like two oxygen sensors together in a sandwich.
The purpose of the pumping cell is to let oxygen into or out of that reference cell, depending on whether it's needed or not.
The computer is always trying to keep that reference cell at a lambda value of one or a metric which would be 14.7 to one air/fuel ratio.
So to do that, the ECU supplies the pumping cell with a current so that the sensor output voltage from the reference stays at a constant. It's trying to keep that reference voltage the same.
When the reference cell is lean, a positive current is used to put more oxygen out of the cell. When the reference cell is rich, a negative current is used to put oxygen in to the cell.
When that reference cell is at lambda one, there'll be no current applied to that pumping cell. So the amount of current supplied is proportionate to the amount of oxygen in the exhaust gases.
The sensor operates correctly only when it reaches a certain temperature, so these things get pretty hot, pretty fast.
With these newer ones it's within 10 seconds. It's hot enough to start and it's over 1,250 degrees.
Also remember, output is opposite of what you'd see with a normal oxygen or a conventional oxygen sensor.
It’s a higher voltage under lean conditions and lower voltage under rich conditions, which is the opposite of how a normal oxygen sensor would work.
It also reacts a lot faster to these AFR sensors and you're usually going to see, because the signal lines are biased with about 2.9 to 3.3 volts. So when it's just sitting there, you'll see roundabout 2.9 to 3.3 volts.
So with our tool hooked up to the vehicle, let's go into the scanner and see what data we can retrieve. Go into Engine then Data Display AF Sensor Data.
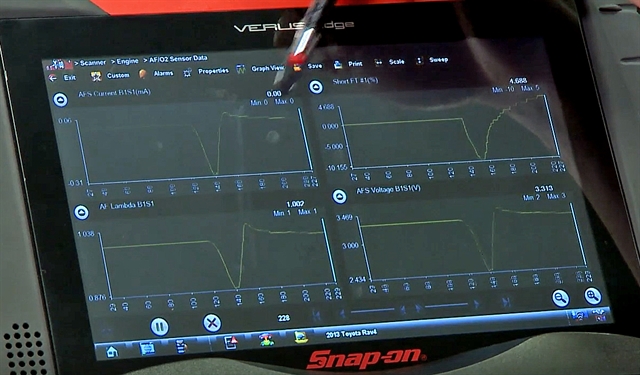
A whole bunch of data is shown but we don’t really need a lot of it so let’s pare it down using a custom data list. Hit Custom, then deselect everything, and in this instance we just need to select AF Lambda, AF Current, AF Voltage. Plus, I’d also like to see what the Short Term Fuel Trim is doing in relation to those.
Go back to the list and graph them all up if you want. You then need to start up the vehicle and see what the graphs show.
You see there's where it started up, at idle, and the computer is trying to keep that lambda back to around one.
So right now we're looking at 1.0 and notice how the current, like it said before, there's going to be no current flowing through as long as that lambda is close to one.
And we can see also the voltage is roughly round about 3.3 volts there. So it's behaving exactly as it would tell us.
So if you hit the throttle a couple of times you can see how quickly the graphs react. Three quick jumps in succession. Everything follows everything else. The short-term fuel trim reacts very quickly.
And this is the reason why these vehicles are so good with fuel economy and can adjust their fuel so quickly, by using those AF sensors.
Most modern vehicles now use electronic throttle control systems, which are generally made up of two throttle position sensors on the throttle plate and two on the accelerator pedal.
This setup allows the vehicle’s computer to figure out where to open the throttle and means one sensor is used for main operation while the other is there as a backup.
But failing or faulty systems can cause issues such as false information being relayed to the car’s computer, poor running and performance, and warning lights being illuminated.
So testing the throttle control system should be part of your routine if a vehicle comes in with similar issues.
The Guided Component Tests included in the vehicle diagnostic software from Snap-on helps you check the system and identify any errors.
It’s like a lab scope with training wheels to help you through the steps you need.
Hook up your diagnostic tool – let’s use ZEUS for this example – and once the vehicle has been identified, head to the Fuel Injection menu within Guided Component Tests, click on Throttle Control System, then connect to the throttle position sensor and run a DC voltage test.
The software shows you what the connector looks like and how to connect your test leads, along with the known good measurements for your vehicle – you’re going to need those in the test.
Set up your meter view so that you can view two channels, which will mean you can see the data from both sensors.
Once you have done that then, with the vehicle’s key on but engine off, press the accelerator pedal a few times to actuate the throttle and generate some data.
Zoom in on the results and use the cursors to check the measurements during the actuation periods – these should be shown by the two lines rising in time with when the pedal was pressed.
The results can then be compared with the known good data and if what you’re seeing falls within the given boundaries you know the throttle position sensors are in good shape.
When you’re checking the graphs you want to make sure that there are no unexpected drop-outs or fuzziness. You will quickly be able to see in the pattern if this is happening.
So diagnosing a throttle position sensor issue needn’t be a huge challenge if it is an issue you find yourself facing.
By Damien Coleman, Product Manager / EBI Specialist
This article describes to technicians how a relatively simple fault became slightly more complicated to rectify when a component with different operating parameters was fitted. Damien Coleman will guide you through how to resolve the issue quickly and effectively by further investigation and testing, using a TRITON-D8.
A 2010 Volkswagen Polo with a 1.6 liter common rail diesel injection engine (engine code - CAYC), was reported to have an engine management light and glow plug warning light both illuminated. A diagnostic scan tool was connected to the vehicle’s data link connector and the following error code was stored in the electronic control module:
P2455 – Diesel particulate filter pressure sensor, short to positive or open circuit.
This fault code can be caused by several factors, which are listed below:
| ● | Short circuit in the wiring between the sensor supply voltage (5 volts) and the signal wire |
| ● | Open circuit on the ground circuit of the sensor |
| ● | Faulty exhaust gas differential pressure sensor |
A voltmeter was connected to the signal wire of the sensor and a voltage of 4.9 volts was measured.
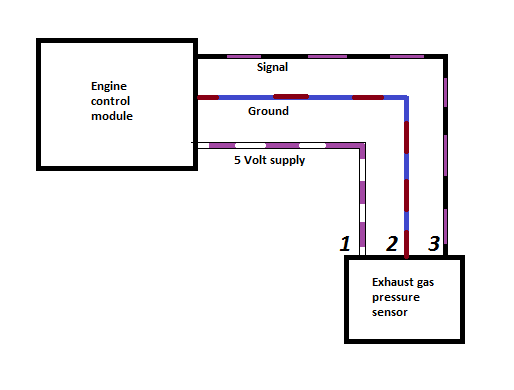
Diagram 1: Component pin assignment:
Pin 1: 5 Volt supply
Pin 2: Ground
Pin 3: Signal output
The simplified diagram above shows the circuit layout. The signal wire (pin 3) has a voltage of ≈5 volts applied to the sensor signal circuit from the engine control module. The sensor is a piezoresistive measuring cell with integrated evaluation electronics.
When the differential pressure is low, the voltage is ‘pulled’ closer to ground potential. As the differential pressure across the filter increases, the output voltage increases proportionally. The engine control module uses this voltage signal to determine the soot loading of the diesel particulate filter.
Increased soot loading will cause an increase in exhaust gas pressure upstream of the filter. This is referred to as 'closed-loop monitoring'.
As we can see from the fault code, several electrical tests must be conducted to pinpoint the actual fault. After the initial voltage test at the sensor signal wire (4.9 volts), the next test was to validate the ground circuit. The ground for the differential pressure sensor is shared with the turbocharger boost pressure sensor and the transmission neutral position sensor, so a fault here was highly unlikely as there were no other fault codes stored in the Engine ECM. However, the circuit was tested and proved to be in good condition. The wiring was also tested for a short circuit between the supply and signal wires which, no fault was found here either.
This proved the fault was within the DPF pressure sensor.
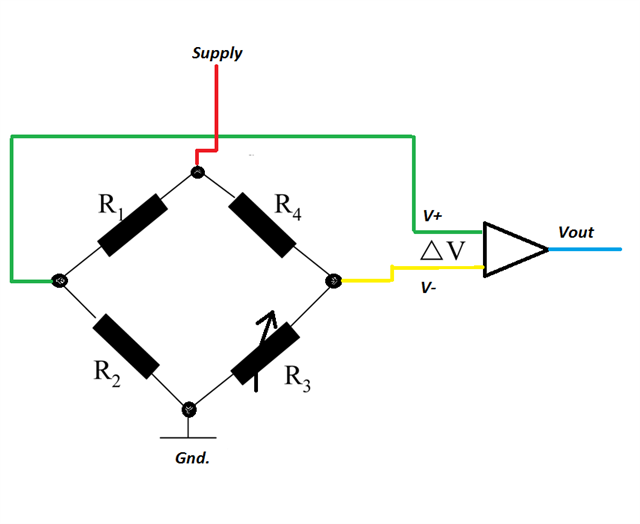
Diagram 2: Sensor construction
The diagram above illustrates a simplified sensor layout, with a piezoresistive bridge circuit connected to an operational amplifier. The bridge is two series of circuits connected in parallel. Normally three resistors within the bridge circuit will have the same resistance value with one resistor having a variable resistance. With zero pressure applied to the circuit, all resistance values are equal so the output from the operational amplifier is zero (V+ = V-). When a pressure change occurs in the sensor, the bridge will become unbalanced and a voltage will be output (Vout) to the sensor evaluation circuit.
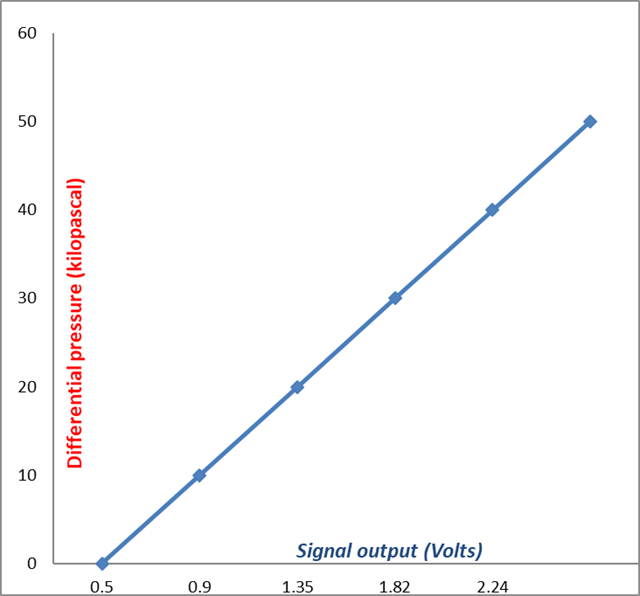
A new sensor was sourced and fitted. A voltmeter connected to the signal wire displayed 0.5 volts with the key on, engine off. With the engine idling, the voltage remained at 0.5 volts and on a road test, increased to 0.9 volts under wide-open throttle; a new fault was now present in the engine management system:
P2453 - Diesel particulate filter pressure sensor, signal implausible
The graph below outlines the normal expected voltage output with respect to exhaust gas differential pressure:
This code would initially clear but would return once the ignition key was cycled (key on, engine off). This was an indication that the engine control module detected an error with the signal voltage under this condition. Any mechanical faults could be ruled out, as the engine did not need to be running for the fault code to return.
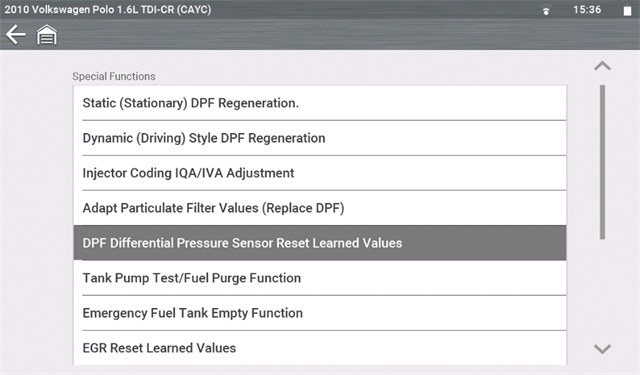
A basic setting for the DPF sensor was carried out using a diagnostic scan tool, however, this procedure failed.
The next step in the diagnostic process was to manipulate the signal output voltage using a potentiometer. The voltage was altered in steps of 100 millivolts and the trouble code was erased at each increment. The trouble code returned each time until a voltage of 1 volt was reached. The code would not return when the ignition was cycled. This indicated the expected key on, engine off voltage from the sensor.
Further investigation into the part supplied was carried out and the issue was found with the supplier of the part. Although the part was ordered from the vehicle identification number, there was a different part number supplied. This can be a normal procedure as parts can often be superseded.
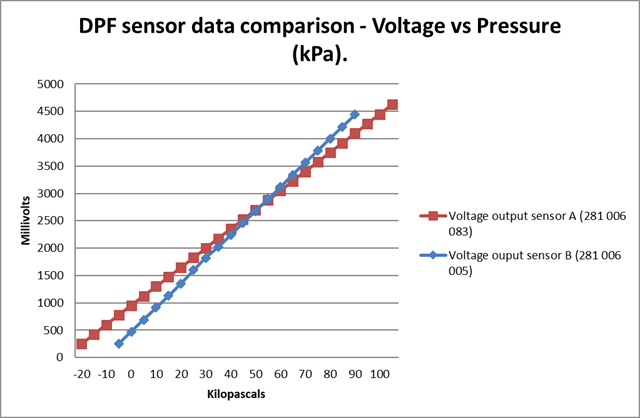
It was later found that the part supplied for vehicles fitted with a Siemens engine control module, was part number 281 006 005. The sensor originally fitted to the vehicle was part number 281 006 083, and these sensors are fitted to engines with a continental engine control module.
With the incorrect sensor fitted, the engine control module interpreted the signal voltage as a pressure of – 15 kPa, hence the implausibility fault code. The graph below outlines the difference in voltage output between both pressure sensors.
The fault code was cleared and the vehicle preformed as expected with the correct DPF Pressure sensor fitted.
Many vehicle manufacturers are now using Magneto-Resistive Hall Effect Sensors (often referred to as Active Type Sensors) for detecting speed, direction of rotation and ‘standstill’ of a rotating assembly. The accuracy of the technology allows many parameters to be detected, which provides the necessary data for an increase in functionality, such as using the automatic parking brake or automatic hill descent technology.
Modern brakes rely on this technology for precise control of the vehicle’s braking system so it goes without saying, a basic understanding is critical to ensure you are confident that repairs are completed correctly and that the vehicle is safe to drive once the job is done. The sensor construction and measuring related waveforms is a useful place to start when getting to grips with complex brake system faults. Take a look at the article below to learn more.
Sensor Construction
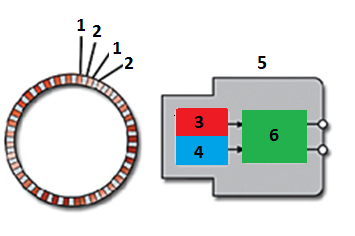
The image below shows how Active Wheel Speed Sensors can detect the direction of rotation. There are two Magneto-Resistive Element (MRE) Sensors close to the phonic wheel, this is the method used to detect the direction of rotation. The sensor integrated circuit can monitor the output phase from both sensors to determine the direction of rotation. A change in magnetic resistance is detected when the phonic wheel rotates. The output from the MRE sensors is interpreted by the evaluation electronics in the sensor’s integrated circuit and an output voltage can be measured at the sensor. The system’s control module uses this output voltage to calculate rotation speed and direction of rotation.
North Pole
South Pole
MRE sensing element 1
MRE sensing element 2
Sensor assembly
Signal processing
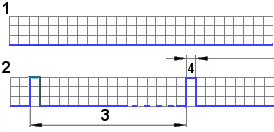
The diagram below displays the difference in output voltage pulse width depending on direction of rotation. Note that the frequency remains the same and the pulse width is the only variable.
Forward direction
Reverse direction
Processed output voltage (Forward)
Processed output voltage (Reverse)
Standstill Monitoring
Another feature of active speed sensors is the ability to monitor ‘standstill’, this is when the rotating assembly is stopped.
The diagram below displays the output signal for such a condition:
Internal sensor output
Actual sensor output
Delta between pulses – 700 ms
Processed output voltage
Sensor Output Voltage
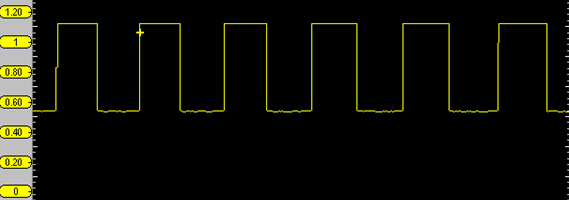
The sensor output voltage signal can be superimposed on the ground wire or the supply wire to the sensor. Both types can be tested with an oscilloscope, and both are shown below:
Signal superimposed on supply wire, oscilloscope coupled to AC to display detail.
Signal superimposed on ground wire.
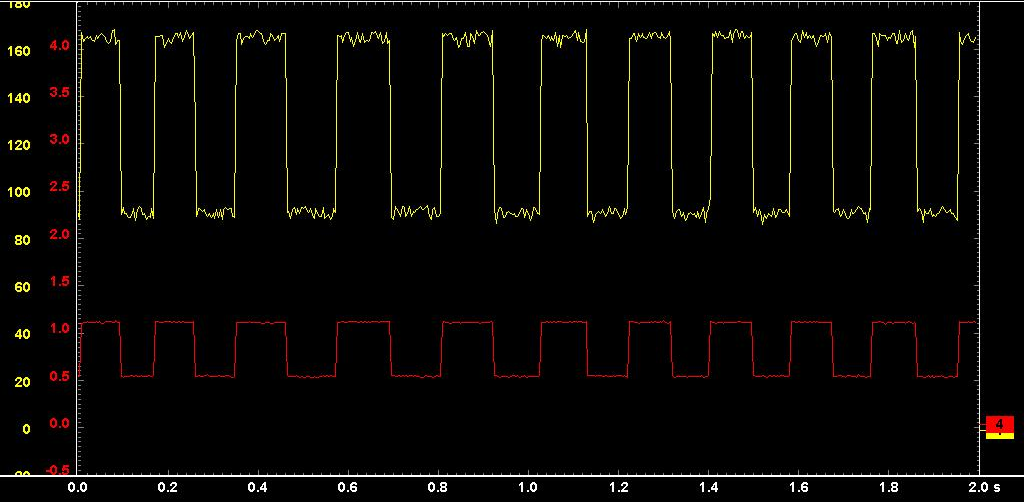
Measured Current Flow
The output current from an active speed sensor is approximately 7mA to 14mA. A micro-amp clamp was used to observe the output current from an active wheel speed sensor.
The red trace displays the output voltage: 0.5 Volts to 1.1 Volts. The yellow trace displays current flow: 9 mA to 17 mA. N.B. use the conversion of 10 mV is equal to 1 mA.
Check out Guided Component Tests on compatible Snap-on platforms for vehicle-specific waveforms and pin assignments.
